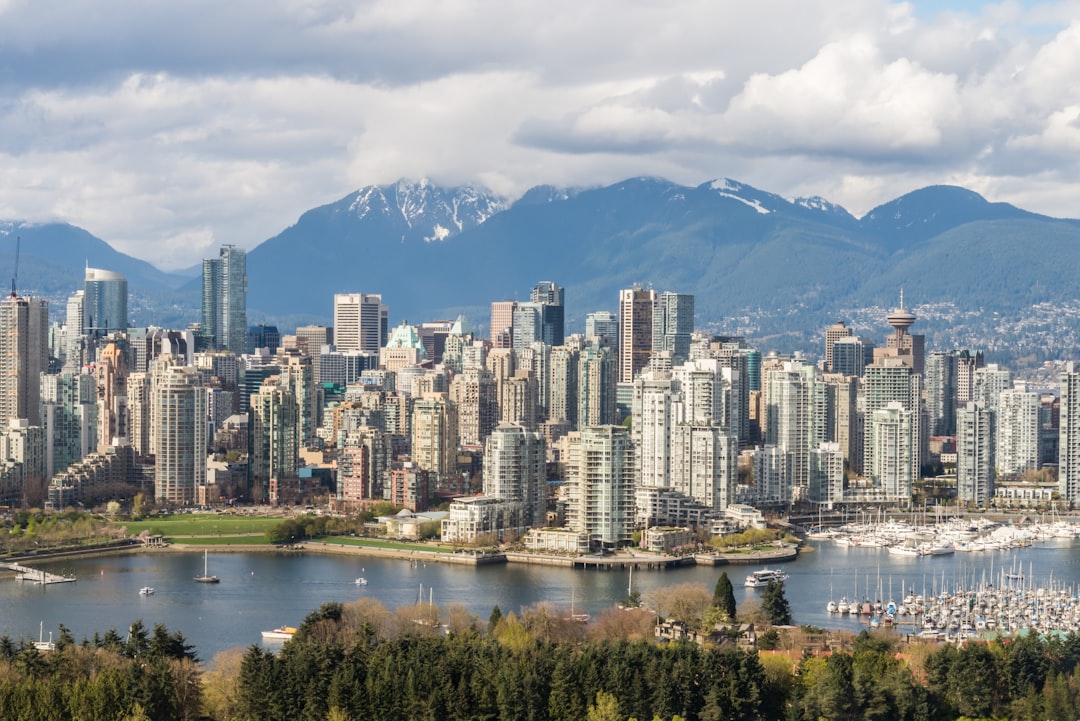
The Metro Vancouver housing market in early 2026 is firmly in buyers market territory, with prices declining across all property types and inventory climbing well above historical averages. In February 2026, the benchmark price of homes in Metro Vancouver was $1,100,300, representing a 6.8% yearly decrease and a 0.2% monthly decrease. The average home price across all property types was $1,206,180, down 1.5% annually. Royal LePage characterizes 2026 as a reset rather than a rebound, with aggregate Canadian prices rising only 1%.
Current Benchmark Prices by Property Type
Detached homes averaged $2,122,572, up 2.7% monthly but down 0.1% annually. The detached benchmark price was $1,835,900, down 8.8% year-over-year. Attached homes averaged $1,184,502, down 7.2% monthly and 3.8% annually. The attached benchmark was $1,046,100, down 5.6% year-over-year. Condo apartments averaged $739,258, up 2.0% monthly but down 5.8% annually. The condo benchmark was $708,200, down 6.8% year-over-year.
Vancouver West Side specifics show a composite benchmark of $1,228,600, down 7.7% year-over-year. West Side detached homes benchmarked at $2,931,700, down 13.7% year-over-year, representing the steepest decline of any segment in the region. West Side townhouses were $1,424,100, down 4.2% year-over-year. West Side apartments were $789,000, down 6.1% year-over-year.
Sales Activity and Inventory Levels
Metro Vancouver recorded 1,648 home sales in February 2026, down 9.8% from 1,827 sales in February 2025 and 28.7% below the 10-year average of 2,310 sales. February sales improved from January 2026 when only 1,107 homes sold, representing one of the slowest starts to a year in over two decades. Detached home sales totaled 427, down 10.5% year-over-year. Apartment sales reached 824, down 15.6% year-over-year. Townhouse and attached home sales were 387, up 7.8% year-over-year.
Active listings reached 13,545 properties, 37% above the 10-year average. New listings totaled 4,734 in February, down 6.4% from February 2025. The overall sales-to-active ratio was 12.6%. Detached homes ratio was 9.0%, clearly indicating a buyers market. Townhouses ratio was 16.6%, indicating a balanced market. Apartments ratio was 14.1%, also indicating a balanced market. The overall market has 8 months of supply, well above the threshold of 5 months that indicates buyer conditions.


Price Forecasts and Market Outlook
Royal LePage projects the aggregate Greater Vancouver home price will reach $1.15 million in 2026, representing a 3.5% decline. Single-family homes are projected at $1,610,915, a 5% drop. Condominiums are projected at $712,853, a 3% decline. The market will likely hover between a buyers and balanced market depending on property type. Entry-level and lower-priced homes with suites remain seller-favored, while luxury properties accumulate inventory favoring buyers.
Detached house prices have plunged below the $1.94 million psychological barrier set in January 2024. The benchmark apartment price has been falling since spring 2024, dropping below autumn 2022 floor levels, with values approximately $50,000 lower than 18 months prior. Average asking rent for one-bedroom apartments has dropped 7% over the past year. Presale launches collapsed with zero new projects in January or August 2025, compared to 750 units typical in January 2018.
CMHC expects marginal growth in sales and prices in 2026 and 2027 as high inventory constrains gains. Over 80% of Metro Vancouver homes sold below asking price in 2025. Home sales hit 25-year lows in 2025, and inventory levels are at the highest point in 3 years. The market is classified as Moderate Risk with potential bubble risk due to prices appearing disconnected from local income levels.
Interest Rates and Suburban Performance
The Bank of Canada overnight rate is currently 2.25% as of January 2026, held since January 28, with total cuts of 275 basis points since June 2024. Vancouver benchmark prices are up 19.2% over 10 years but currently 12.2% below the April 2022 peak of $1,252,800. Since January 2005, prices have increased 215%, representing a 5.6% compound annual growth rate.
North Vancouver benchmark was $1,279,300, down 5.9% year-over-year. West Vancouver was $2,317,000, down 7.9%. New Westminster was $741,500, down 9.4%. Coquitlam was $997,300, down 7.8%. Average residential prices in Greater Vancouver were $1,243,360 in late 2025, down 3.8% year-over-year. Overall sales volume across Greater Vancouver was 20,332 in 2025, down 9.4%. Active listings were 15,790, up 23%.
Dunbar-Southlands
- Avg Price
- $3,443,150
- For Sale
- 37
Yaletown
- Avg Price
- $301,200
- For Sale
- 51
Fairview
- Avg Price
- $1,614,000
- For Sale
- 30
Coal Harbour
- Avg Price
- $679,000
- For Sale
- 17
West End
- Avg Price
- $657,450
- For Sale
- 55
Marpole
- Avg Price
- $488,000
- For Sale
- 76
Kensington-Cedar Cottage
- Avg Price
- $1,399,000
- For Sale
- 32
Downtown Vancouver
- Avg Price
- $750,000
- For Sale
- 73
Renfrew-Collingwood
- Avg Price
- $2,499,000
- For Sale
- 58
Mount Pleasant
- Avg Price
- $649,900
- For Sale
- 56
Kerrisdale
- Avg Price
- $1,624,900
- For Sale
- 34
Gastown
- Avg Price
- $653,000
- For Sale
- 13
Compare with other markets: Surrey Market Trends | Toronto Trends | Calgary Market | Edmonton Trends